Introduction
Real estate is a huge asset class. According to Savills Research in 2020, the total value of global real estate, including residential, agricultural, and commercial real estate was $327 trillion (~80% residential). Compare that to global equities ($109 trillion) and global debt ($124 trillion) and it is clear that real estate makes up a sizable portion of the investment market. The non-residential real estate market alone is over 60% as large as global equities.
It’s not hard to find compelling arguments to allocate to real estate. As an example, we can turn to Nareit whose mission is “to actively advocate for REIT-based real estate investment with policymakers and the global investment community.” Here’s why Nareit says investors should allocate to REITs:
“REITs historically have delivered competitive total returns, based on high, steady dividend income and long-term capital appreciation. Their comparatively low correlation with other assets also makes them an excellent portfolio diversifier that can help reduce overall portfolio risk and increase returns.”
The diversification point is important and on this Nareit expands:
“Listed REITs help to diversify a portfolio because, as real estate, they are a distinct asset class that has demonstrated low-to-moderate correlation with other sectors of the stock market, as well as bonds and other assets. In other words, REIT returns have tended to zig while returns of other assets have zagged1, smoothing a diversified portfolio’s overall volatility.”
Lowly correlated, diversifying assets with competitive returns are attractive and it should be no surprise that investors choose to allocate to them. Consider Target Date Funds (TDFs) which have trillions of dollars of AUM. According to Nareit, REIT allocations within TDFs have climbed over the past 15 years, and TDFs consistently overweight REITs relative to their implied index weights. See Chart 1 from the Nareit report below. These results are consistent with Callan’s report on TDF asset allocation glidepaths.
Chart 1. TDF vs Market Index REIT Allocation Weights: 2005-2020 (25 Year-to-Retirement Cohort)
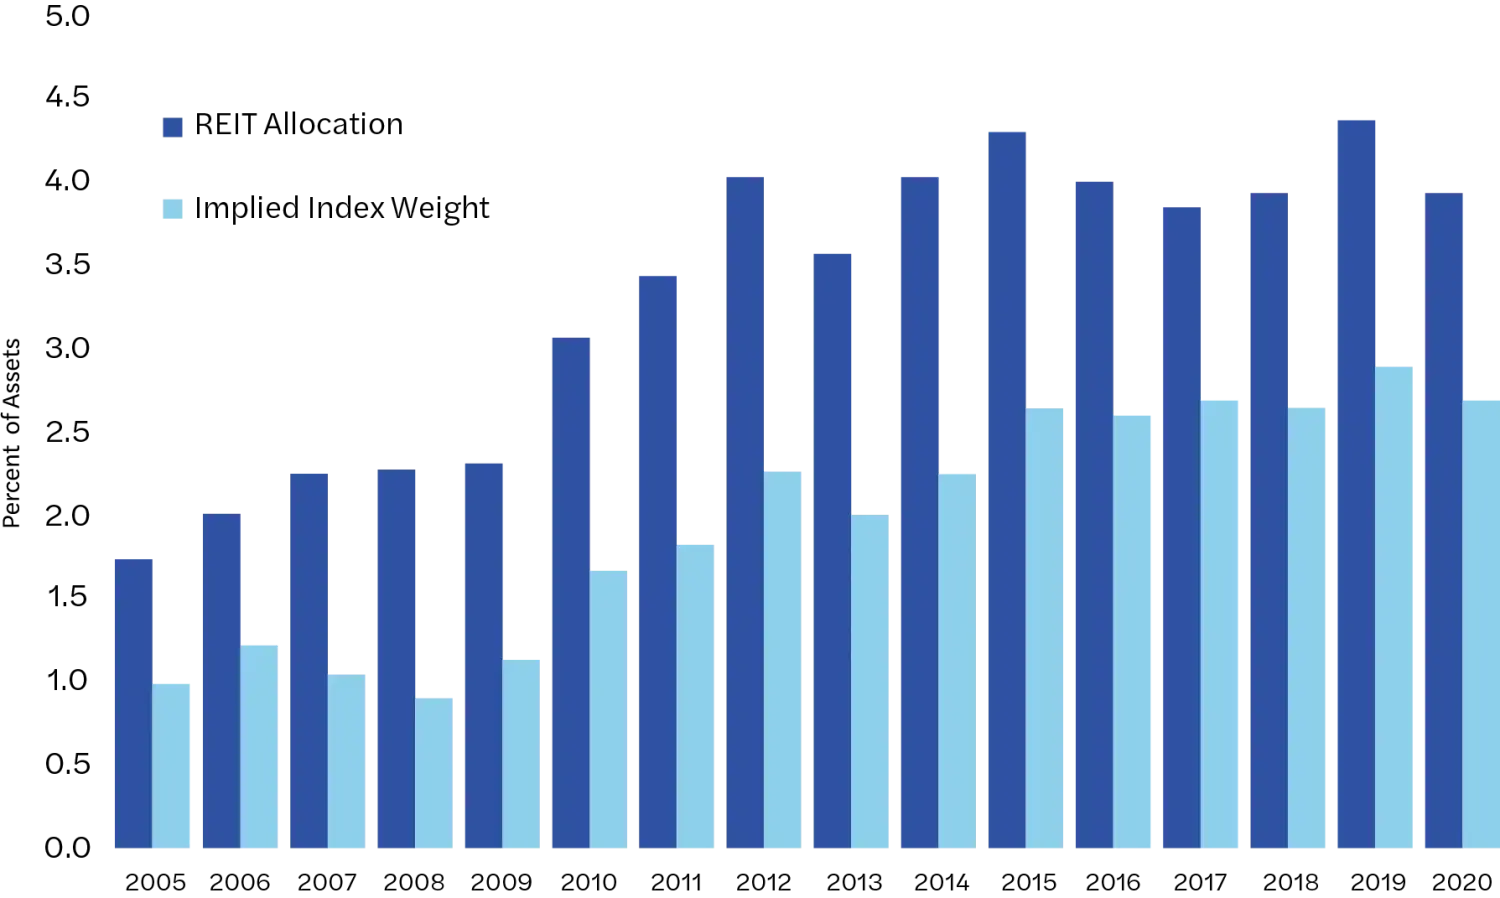
Source: Nareit analysis of Morningstar Direct data. Averages of asset weighted average portfolio allocation to REITs. The 25 years to retirement cohort is represented. Target weight based on blended REIT share of S&P 500 and Total Stock Market funds.
It’s worth asking — are such allocations and overweights are justified? Are exchange-traded REITs competitive return, low correlation diversifiers?
This article asks and answers that question, investigating the potential benefits of incorporating tradable Real Estate Investment Trusts (REITs) into a diversified multi-asset class portfolio. Sadly, I find overweighting was not justified and that REITs have not historically been competitive, low correlation diversifiers.
First, some preliminaries.
Investing in Real Estate: Preliminaries
Individuals often buy and manage real estate of various types themselves – single-family residential, commercial, self-storage, campgrounds, strip malls, vacation rentals, etc. Such a hands-on approach with concentrated investments has its risks and rewards, but those are outside the scope of this article. Here, I focus instead on hands-off, professionally managed, diversified real estate investing instead.
Real Estate Investment Trusts (REITs) offer investors diversified exposure to real estate. There are several types of REITs, including public or private, and public REITs can either be listed or non-listed.
Listed REITs are professionally managed investment vehicles that behave much like stocks, trading on public exchanges with their prices following typical supply-demand market forces. In fact, as of July 20, 2022, about 30 out of the 500 constituents of the S&P 500 Index were REITs2, making up just under 3% of the index’s market capitalization. Exchange Traded Funds (ETFs) can provide diversified exposure to a basket of individual REITs, and REIT-focused ETFs trade just like any other ETF. For those seeking diversified real-estate exposure, listed REITs or REIT-focused ETFs are convenient.
Non-listed REITs are also professionally managed, comingled investment trusts. However, investments in non-tradable REITs are made via a subscription document and disinvestments occur via redemption requests. Prices (Net Asset Values of the REIT) used when subscribing to or redeeming from a non-tradable REIT are established via audited valuations of individual properties held within the trust. Non-listed REITs tend to be more liquid than private REITs, but less liquid than tradable REITs. Investment managers typically gate redemptions, allowing perhaps up to 2% of total fund value to be redeemed per month and up to 5% of total fund value to be redeemed per quarter. If redemption requests exceed these limits, then an investor might receive a pro rata share of their redemption request.3
Private REITs are illiquid instruments that are exempt from SEC registration. Their shares are not exchange traded and redemptions may be limited or prohibited. Access to private REITs is generally limited to accredited or institutional investors.
Listed REITs
Listed REITs can provide convenient exposure to real estate. But what are their investment attributes? Let’s look. I’ll focus my attention on the Vanguard Real Estate Index Fund ETF (ticker: VNQ). It launched in late 2004 and provides exposure to a large basket of individual, tradable REITs.4 As of October 31, 2022, it held 166 individual REIT stocks and its Net Asset Value was $63.7b. It can serve as a reasonable representation of the public, tradable REIT market.
Vanguard Real Estate ETF Product Summary5
- Invests in stocks issued by real estate investment trusts (REITs), companies that purchase office buildings, hotels, and other real property.
- Goal is to closely track the return of the MSCI US Investable Market Real Estate 25/50 Index.
- Offers high potential for investment income and some growth; share value rises and falls more sharply than that of funds holdings bonds.
- Appropriate for helping diversify the risks of stocks and bonds in a portfolio.6
Let’s start with some basic summary statistics. Table 1 reports annualized returns excess of the risk-free rate, annualized volatility, Sharpe ratio, and the worst peak-to-trough drawdown for the Vanguard REIT ETF (ticker: VNQ) as well as for a broad, U.S. equities ETF (ticker: VTI) and a U.S. long-term bonds ETF (ticker: TLT) that Vanguard offers for reference.
Table 1: Summary Statistics for REIT, Equity, and Bond ETFs, October 2004 to September 2022
| VNQ | VTI | TLT | |
|---|---|---|---|
| CAGR | 7.2% | 9.0% | 4.0% |
| Avg Excess Return | 8.4% | 8.7% | 3.7% |
| Volatility | 22.3% | 15.6% | 13.3% |
| Sharpe Ratio | 0.38 | 0.56 | 0.28 |
| Worst Drawdown | -70.1% | -52.1% | -38.3% |
| Correlation to VTI | 0.75 | -0.21 | |
| Correlation to TLT | 0.03 | -0.21 |
Source: NDVR, Center for Research in Security Prices, and French Data Library
Right out of the gate, we see that REIT average excess returns were not too dissimilar from U.S. equities over this period. In the aggregate, REITs were certainly more volatile, realizing nearly 50% greater volatility and a 35% worse peak-to-trough drawdown. The correlation of the REIT ETF to the equity ETF was 0.75. That’s high, but “low” enough that many investors and strategists can reasonably conclude that REITs are a good diversifying addition to a typical equity portfolio. With a correlation of essentially zero to bonds, the same investors could conclude that REITs are a good diversifying addition to a portfolio of bonds and equities. I believe those investors would be wrong on both counts.
A careful analysis illuminates why. A linear regression of REIT returns on equity and bond returns identifies REIT exposure to these two important markets. The results of this regression are reported below (t-Statistics in parenthesis):

Correlations don’t quite tell the story! Over the past couple of decades, REITs (as represented by VNQ) had over 110% exposure to equities and over 30% exposure to bonds, indicating REIT investments include exposure to interest rates. It seems they have embedded leverage: $100 invested in a REIT behaves (sort of) like having $114 invested in equities and $34 invested in bonds, with $48 borrowed to finance the heightened exposure.7 Exchange-traded REITs have been described as zigging when the market zags. To the contrary, the REITs have tended to move with the market with heightened velocity and yet underperformed. It’s the worst of both worlds.
Constructing a Synthetic REIT
This embedded leverage can make a REIT interesting for those who are seeking a more aggressive posture. But it means that we must find or construct a more appropriate benchmark. Benchmarking against equity would be inappropriate, although the exchange-traded REIT already fares poorly against equity alone as it has had higher beta with lower return. We require a benchmark with similar underlying exposures.
We can synthesize a diversified exchange-traded REIT exposure by constructing a levered portfolio that owns 114% equities and 34% bonds.8 This portfolio has, by construction, the same underlying exposure to equities and bonds as does the REIT ETF. The important question now is what does an actual exchange-traded REIT (or portfolio of exchange-traded REITs held by an ETF) provide that this synthetic REIT does not?
Table 2: Synthetic REIT Performance, October 2004 to September 2022
| VNQ | Synthetic VNQ | Residual | |
|---|---|---|---|
| CAGR | 7.2% | 11.3% | -2.6% |
| Avg Excess Return | 8.4% | 11.2% | -2.8% |
| Volatility | 22.3% | 17.4% | 14.0% |
| Sharpe Ratio | 0.38 | 0.64 | -0.20 |
| Worst Drawdown | -70.1% | -54.4% | -68.2% |
| Beta to VTI | 1.14 | 1.14 | 0.0 |
| Beta to TLT | 0.34 | 0.34 | 0.0 |
Source: NDVR, Center for Research in Security Prices, and French Data Library
Table 2 reports the track record of the synthetic REIT and compares the REIT ETF (VNQ) to it. The REIT ETF doesn’t look so good in comparison. The REIT ETF’s returns were 28% more volatile than those of the synthetic REIT, and yet its compound annual growth rate was 36% lower (a 4.8% difference in CAGR).9 Not coincidentally, the synthetic REIT’s 2.8% annualized (arithmetic) outperformance exactly matches the reported -2.8% alpha in the regression above.10 The REIT ETF had barely over half the Sharpe ratio of its synthetic benchmark.
The compounding effect over the 18-year sample is dramatic: $1 invested in VNQ grew to $3.48, but the same $1 invested in the synthetic REIT grew to $6.90. Investing in the REIT over 18 years resulted in about half the terminal wealth of its synthetic counterpart. The negative alpha took its pound of flesh.
We isolate the real estate component of the REIT ETF by looking at the properties of its returns in excess of its synthetic REIT benchmark. This ‘residual’ specifically isolates the component of the REIT ETF’s returns that is unrelated to equity or bond markets. The volatility of this component was 14.0%. This means that investing in the REIT ETF was like investing 114% in equity, 34% in bond, and 100% in a real-estate specific component that on its own had volatility not much lower than that of equities. A lot is going on within the collection of REIT interests held by VNQ!
The real-estate specific risk within a REIT is material (although perhaps counterintuitive, that’s good news as it’s kind of the point of investing in a REIT in the first place). However, the average return earned for taking this risk was -2.8%. That’s a lot of risk to take on to lose money on average! In fact, the Sharpe ratio of this component was -0.20. Allocating significant risk to an exposure with a -0.20 Sharpe ratio is not an optimal use of an investor’s risk budget.
Note: It’s not all that surprising that an asset with high embedded leverage has disappointing performance and negative alpha relative to portfolios with explicit leverage. The papers titled Embedded Leverage by Andrea Frazzini and Lasse H. Pedersen and Betting Against Beta by the same authors show that across several assets and asset classes, those instruments with high embedded leverage tend to underperform portfolios that lever lower-risk assets. We can add tradable REITs to the mix.
Optimal Allocation to the Tradable REIT
We can use mean-variance optimization techniques to determine what the optimal historical allocation to VNQ would have been. Investing in REITs provides portfolio diversification but has come at a historical cost of -2.8% of annualized alpha. Do the diversification benefits outweigh the return drag costs? The basic process is as follows:
- Use historical return, volatility, and correlation information to determine the Sharpe ratio maximizing fully-invested portfolio of VTI and TLT.
- Find the volatility of this optimal portfolio.
- Use historical return, volatility, and correlation information to determine the maximum return portfolio of VTI, TLT, and VNQ that has the same volatility as the benchmark equity/bond portfolio.
After taking these steps11, here’s what I find. The optimal portfolio of stocks and bonds would have invested 57% in equity and 43% in bonds. This portfolio would have realized a volatility of 9.5% and excess of cash returns of 6.5%, for a Sharpe ratio of 0.69.
If we add the REIT to the mix, we find that a portfolio that is invested 76% in equity, 47% in bonds, and short 19% of the REIT is mean-variance optimal. This portfolio matches the 9.5% annualized volatility of the equity and bond portfolio, but earns 6.8% instead, for a Sharpe ratio of 0.72.12
A 27-basis point improvement in return and a 0.03 improvement in Sharpe ratio for the same amount of risk is modest, but not immaterial. But the important point is the following. If we use VNQ as a reasonable proxy for a portfolio of individual exchange-traded REITs to determine the optimal investment in exchange-traded REITs, the answer is negative. Not only do you not want to buy the portfolio of exchange-traded REITs, but you want to short it! This is entirely consistent with the negative 2.8% alpha reported in the regression above. Rule of thumb: buy positive alpha assets and short negative alpha assets, like the publicly traded REIT.
Conclusion
Careful performance attribution indicates that investing in real estate via exchange-traded REITs has been a raw deal over the past couple of decades. Unless we believe the future to be materially different than the past, it would be difficult for an optimally diversified equity and bond investor to justify an allocation to real estate using these instruments. Those who allocate to exchange-listed REITs and especially those who overweight them, including many Target Date Funds, might benefit from reevaluating their asset allocations.
Disclosure
Roni Israelov is President and Chief Investment Officer at NDVR, Inc. E-mail: roni.israelov@ndvr.com.
This material is published for informational purposes only.
The views expressed and other information included are as of the date indicated and based on the data available at that time. They may change based on changes in markets, general economic conditions, rules and regulations, and other factors. NDVR does not assume any duty to update any of the views and information herein. Unless otherwise noted, views and opinions expressed are those of the authors and not necessarily those of NDVR or its affiliates.
NDVR is an investment advisor that may or may not apply the views and other information described herein when providing services to its clients. The views and information herein are not and may not be relied on in any manner as, investment, legal, tax, accounting or other advice provided by NDVR to any individual or entity or as an offer to sell or a solicitation of an offer to buy any security.
Footnotes
-
Emphasis mine. ↩
-
Blackstone, Starwood and KKR recently made headlines when gating redemption requests in their public, non-listed REITs. ↩
-
A sample period beginning in 2004 is admittedly short. I selected the Vanguard ETF because it is easily tradable, and the data is readily available for analysis. I note that my findings are generally consistent with those reported in Real Estate Betas and the Implications for Asset Allocation by Peter Mladina which investigates REIT performance over the period 1986 through 2015 and the paper Are REITs a Distinct Asset Class? by Jared Kizer and Sean Grover, which investigates REIT performance over the period 1978 through 2017. ↩
-
Vanguard Real Estate ETF as of July 20, 2022. ↩
-
Here’s another assertion of the diversifying properties of REITs. ↩
-
The regression tells us that VNQ has 114% exposure to equity (as proxied by VTI) and 34% exposure to long-term bonds (as proxied by TLT). It also tells us that a portfolio that owns 114% VTI and 34% TLT, financed by borrowing at the short-term risk-free rate explains 60% (the R2) of the variance of VNQ. That means 40% of the variance is unexplained by equities and bonds, and the regression further tells us that the historical alpha of this residual was -2.8% annualized. ↩
-
The paper Are REITs a Distinct Asset Class? by Jared Kizer and Sean Grover similarly explores the idea of synthesizing the REIT return, which they refer to as Portfolio Replication. There are two primary, but important differences in my approach versus theirs.
First, I replicate using two primary risk-premia ETFs that provide passive U.S. equity and bond exposure whereas they replicate using a U.S. small-cap value equity and Barclay’s Capital Long-Term Corporate Bond Index. In so doing, they add three additional risk-premia to the mix: value, size, and credit, widening the performance gap between REITs and their synthetic counterpart. The inclusion of these additional exposures is well-supported by their regressions. I intentionally set a higher bar in my analysis by only horseracing the REIT against two risk premia rather than five.
The second difference, however, is more important. They constrain their replicated portfolio to have 100% allocation (un-levered). This means that their synthetic REIT does not match the equity or bond betas of the REITs they intend to replicate. By allowing for leverage in my synthetic replication, I match underlying exposure to the two incorporated risk premia and the residual of REITs that is not spanned by equities or bonds represents only the returns provided by REITs that is unattainable by investing in passive equity or bonds.
Despite these significant differences in approach, our conclusions are similar. ↩
-
The 4.8% difference in compound annual growth rate is larger than the 2.8% difference in arithmetic annualized returns due to volatility drag. Volatility reduces compound growth rates, and the REIT was significantly more volatile than its synthetic counterpart. Higher volatility drag reduced relative annualized compound performance by about 2.0%. ↩
-
Note the t-Statistic of the alpha is -0.82 and thus the alpha is not statistically significant. Also note that an alpha of -6.7% would have been required to reach statistical significance. This is an example of limitations in data requiring an economically enormous alpha to achieve statistical significance. ↩
-
An alternative mean-variance framework would go as follows. In the second step, infer the investor’s risk aversion coefficient from the portfolio identified in step one. In the third step, solve for the mean-variance optimal portfolio applying the inferred risk-aversion coefficient to the broader set of investments. In this alternative version, the investor would take no less volatility in the three-asset portfolio than in the two-asset portfolio because the Sharpe ratio cannot be lower after adding the third asset. In my analysis, I chose to constrain volatility to reduce the number of moving ‘parts’. ↩
-
The paper Are REITs a Distinct Asset Class? by Jared Kizer and Sean Grover also tests the optimal mean-variance allocation to REITs in three different settings with mixed results. When the allocation is unconstrained to include S&P 500, 5-Year Treasuries, U.S. small-cap value, and REITs OR to include U.S. small-cap value, long-term corporate bonds, and REITs, they find that the optimal allocation to REITs as negative. This result is consistent with my analysis. They also test the optimal allocation to REITs against a portfolio that is 60% S&P 500 and 40% 5-year U.S. Treasuries, locking the ratio between them. In this case, the optimal allocation to REITs is positive. It’s possible that an investor who has no flexibility in the ratio of their equity to bond allocation might have benefited from a REIT allocation, but it’s an artificial constraint that can easily be lifted. ↩